Click here
# Describe the Doppler effect. What causes it?
# What is a redshift?
# How can the degree of redshift in the color spectra of a supernova tell astronomers about the movement and location of stars?
Wednesday, March 2, 2011
Friday, February 4, 2011
Lab 4: The Moons of Jupiter
Log on using the Tech acct if you are doing this at school.
Download the file found here
Create a chart using 30 days of data for all of Jupiter's moons.
Download the file found here
Create a chart using 30 days of data for all of Jupiter's moons.
Thursday, November 6, 2008
All the pieces of the total...20 points

Pick one of the following: Mercury, Venus, Mars, the asteroid belt, Jupiter, Saturn, Uranus, Neptune, Pluto, the Oort Cloud, the Kuiper belt, comets, or killer asteroids. Find a video in English from unitedstreaming.com or Youtube and embed it in your blog. Summarize the video, and provide information about the size of the object(s) in comparison to Earth (8000 mi/diameter), its distance to the Sun, space exploration efforts, weight on this object in comparison to Earth (if you can find it), and material composition (metal, water, rock, etc.). You may wish to Google "Your weight on other worlds" or go to 9 Planets for more help
Thursday, October 16, 2008
The LAST ASSIGNMENT--30 Points
You are almost there! Congratulations! By the end of this month, your efforts in astronomy will be locked up and away in the old gradebook vault.
But, today, you still have this blog activity and one other to do. This project deals with the Expanding Universe and the work of Hubble, which leads to the current picture provided by WMAP.
YOU DO NOT NEED TO POST THIS ACTIVITY ON YOUR BLOG. You DO need to hand in a worksheet.
Download the software from here.
Print the worksheet from here. You will need one worksheet for every two to three people (Group work will not be accepted if more than three people are on a sheet. If the substitute notices a lack of effort, you may receive a zero even IF your name is attached to a sheet). The lab has been reserved for you to work.
This lab is similar to the stellar spectra lab we did earlier in the term, and the telescope operates the same way, but you are using galaxies, not stars. Your signal/noise ratio must be 15 in order to be valid.
Wednesday, October 15, 2008
Two sides to every story

Is there life out there? What do you think? Go to Origins and take the interactive quiz. It presents both sides to every story.
When you get done, manipulate the Drake equation to allow less than 10, more than 1000, and more than 10000 civilizations in a galaxy.
Summarize your ideas and rationale behind them on a post on your blog.
Sunday, October 12, 2008
Thursday, October 9, 2008
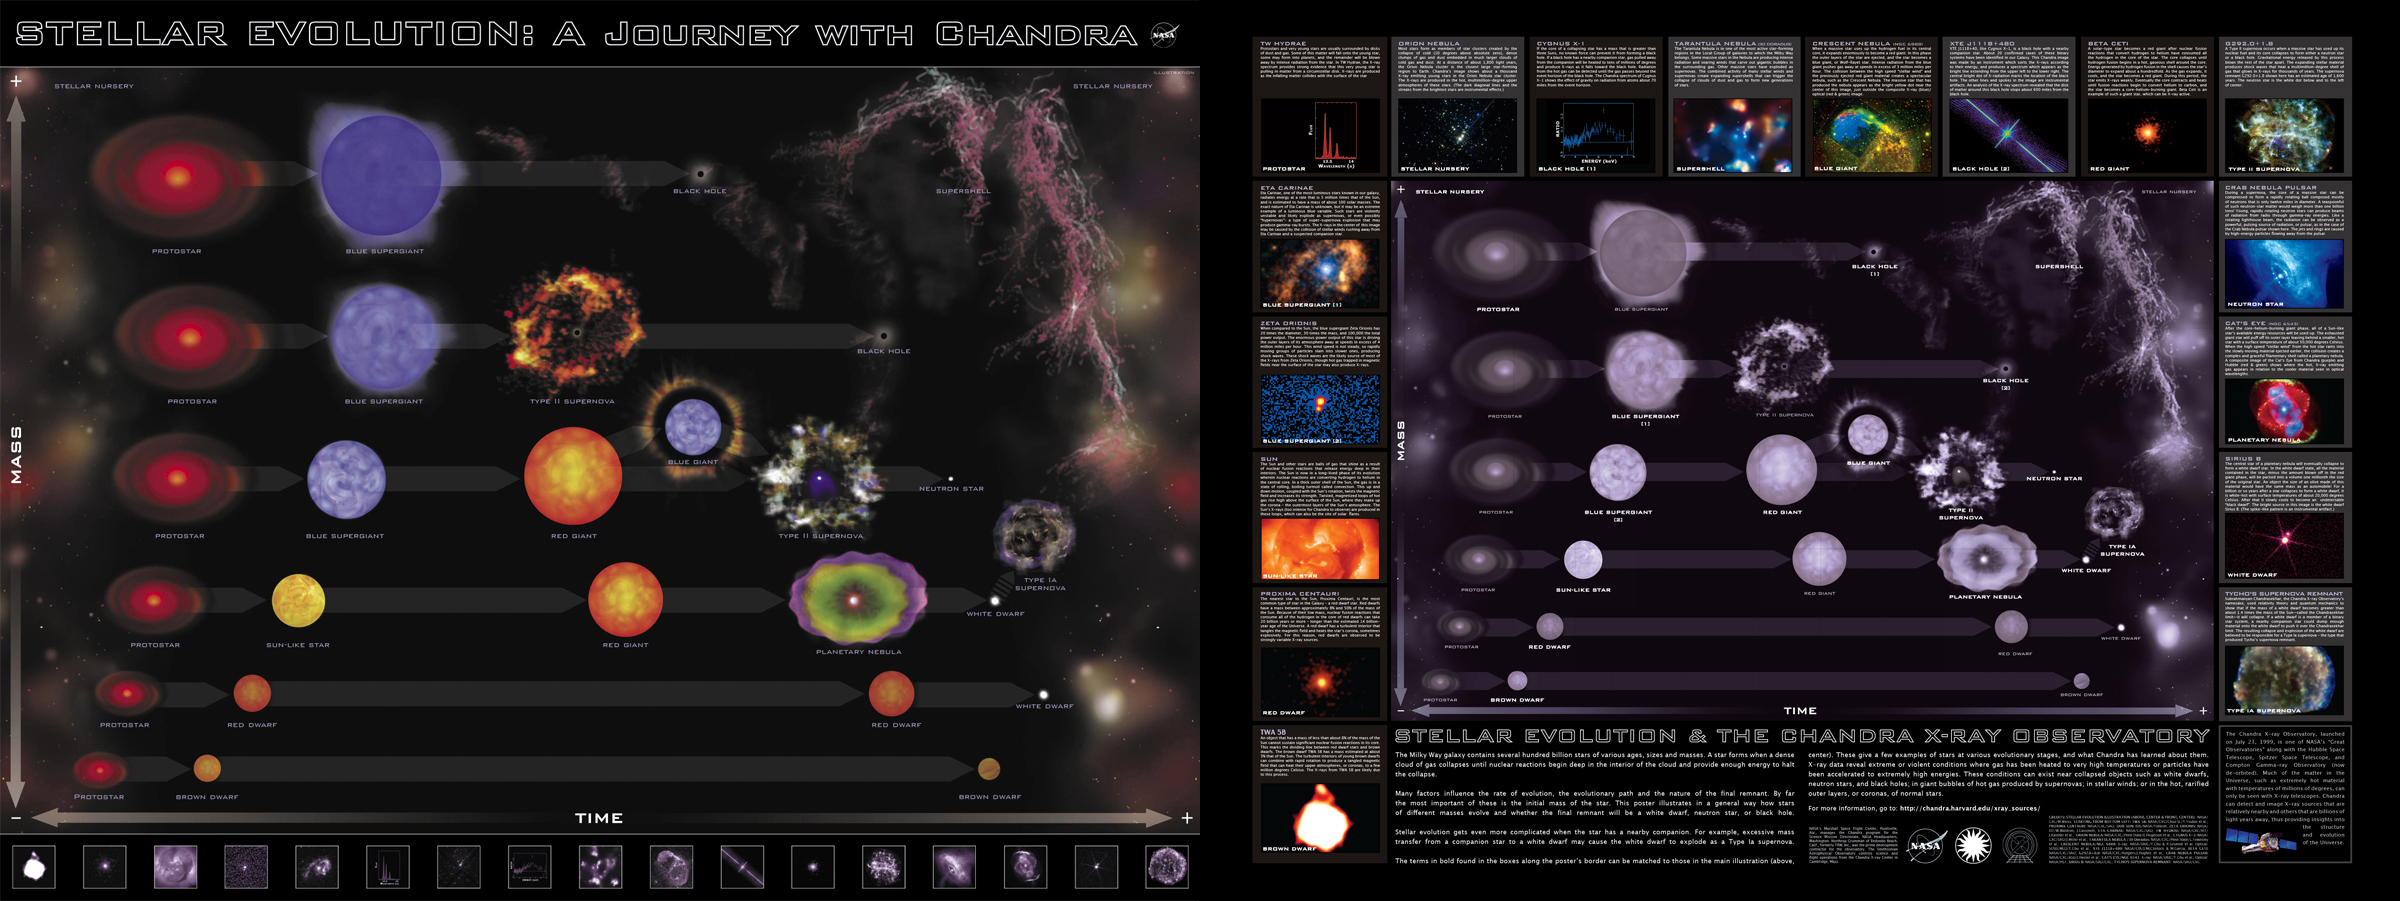
Stellar Evolution--a better picture
Subscribe to:
Comments (Atom)